Download: Get the paper in PDF from here
Abstract
In this paper, we estimate the perceived quality of images by sparse representations obtained from popular image processing databases with unsupervised learning method. Several operations are applied to the database images to enhance the learning result, including applying the edge detection filter to the intensity channel and attaching the result as a fourth channel to the original image in order. The pre-processed images are then fed to a linear decoder to obtain sparse representations, followed by suppression mechanisms for the visual system. Detailedly, the linear decoder is trained with 100,000 image patches of size \(8\times8\) randomly obtained from 1,000 images in the ImageNet 2013\({}^{[2]}\) database. The proposed quality estimation method EDB-UNIQUE is tested on the LIVE\({}^{[3]}\) and Multiply Distorted LIVE\({}^{[6]}\) databases and compared with the native database-enclosed SSIM quality estimator and the original UNIQUE quality estimator. Based on experimental results, the EDB-UNIQUE method provides better estimation in most categories compared to the original UNIQUE approach.
INTRODUCTION
With the high-speed network emerging and spreading in recent years, online applications have grown rapidly. At such age that almost everyone serves as the content creator and thus provides an enormous amount of media information, evaluating the quality of images in bulk is absolutely necessary and critical. Also, with the trend of cellphone manufacturers pushing bigger image sensors and high-end camera modules to that digital device everyone always holds on hand or keeps in pocket these days, together with the faster WIFI and cellular network introduced recent years, high-quality images are fast populating. Hence, the need of a better method to assess images for objective scores closer to subjective impression definitely exists. While authors in [1] have developed an unsupervised learning algorithm to mostly fulfill the need, improvements based on that could be made so as to let the objective results of such method be more approached to the subjective results.
In this paper, we develop a new approach based on the original UNIQUE algorithm, to focus on more specific cases as well as to provide better results overall.
METHODOLOGY
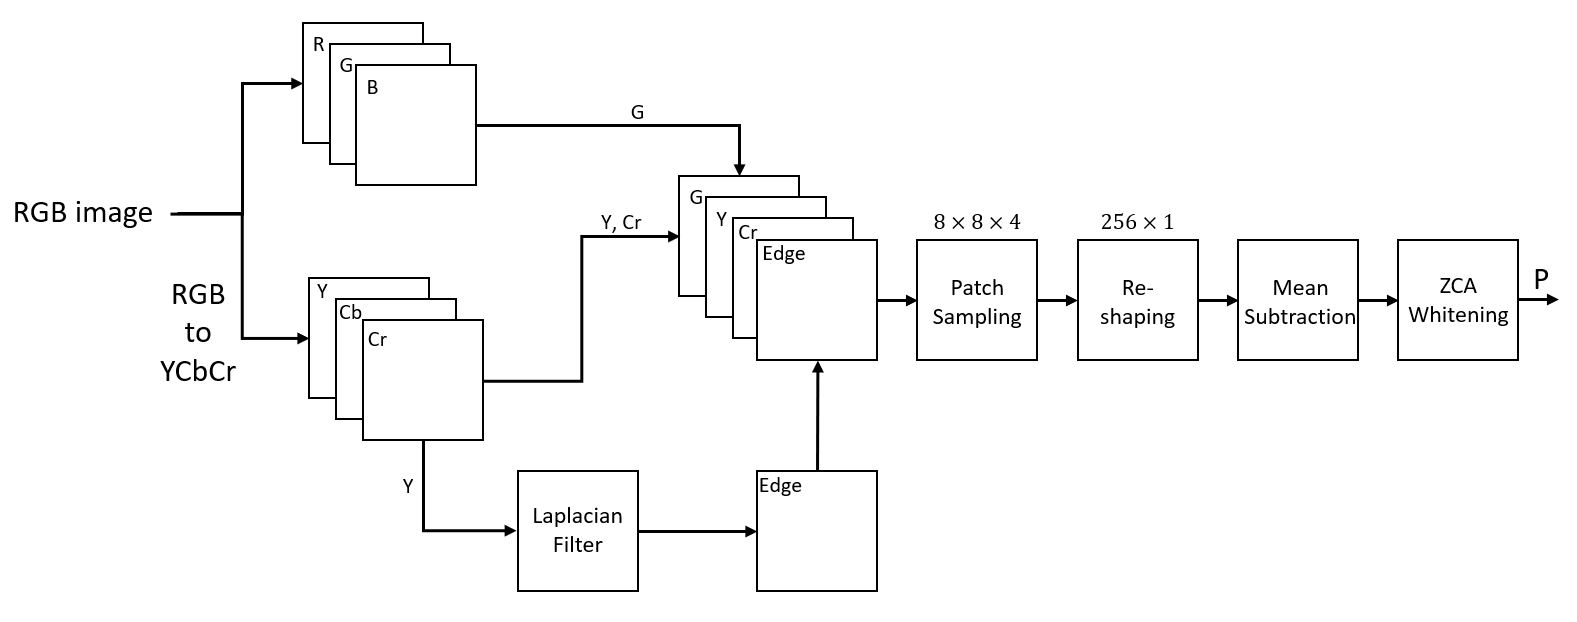
We transform RGB images into YCbCr images as UNIQUE. UNIQUE picks three channels Y, G and Cr channels as input for patch generation. Different from UNIQUE, we add an additional channel, the edge channel. The main reason for this pre-processing is we want this quality assessment method to pay more attention to edge distortions. In the demonstration of UNIQUE, we found that the sparse representation lost a lot of information in the texture area. Therefore, we want sparse representation to create more features describing edges. Since the number of input values for sparse representation increases, we increase the number of elements in sparse representation consequently.
| Fig. 1. The Pipeline of EDB-UNIQUE |
|---|
 |
Color Space Conversion
Like UNIQUE, we focus on luminance (Y channel) of the YCbCr color space, as the changes in intensity domain compared to those in chroma are more sensitive to human visual system.\({}^{[7]}\) However in addition, we apply the edge detection filter to the intensity and use it as the fourth channel of our custom-defined color space, in order to preserve more edge features. Also, the green channel of the RGB color space is selected to represent the three RGB channels, since the green channel contains most information from R and B color channels. A paper\({}^{[8]}\) is already existing to prove such result by showing the cross-correlation between channels of RGB representations, the correlation \(r_{RG}\) between R and G color channels is 0.98 and the cross-correlation \(r_{GB}\) between G and B color channels is 0.94.
Hence, we augment Y and Cr channel of YCbCr space, G channel of RGB space, and our edge detection filtered channel together into a custom-defined 4-channel color space. The images from the database are processed to be transformed into such color space for following procedures.
Edge Detection Filter
The 4th.(edge) channel is generated by the edge detection filter. Since Y channel represents the intensity of images, we convolve the Y channel images with an extended Laplacian filter to obtain the edge channel, as the extended Laplacian filter is shown below:
\[\begin{aligned} L = \begin{bmatrix} 1 &1 &1\\ 1 &-8 &1\\ 1 &1 &1 \end{bmatrix} \end{aligned}\]Linear Decoder Training
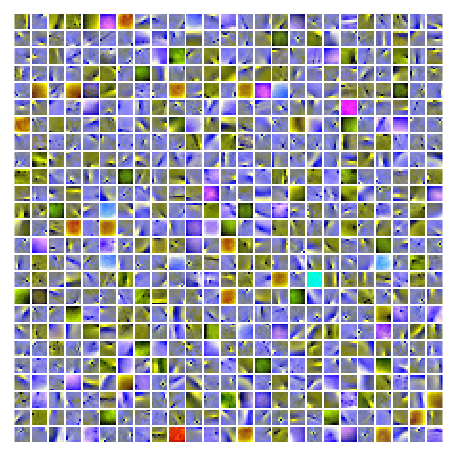
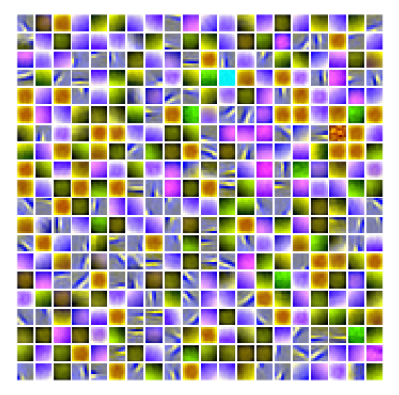
After applying the edge detection filter to images, and being transformed into the 4-channel color space, like what is done in UNIQUE, 100 of \(8\times8\) patches are randomly chosen in each individual image and then reshaped into \(256\times1\) vectors. These vectors are fed into the training algorithm to train sparse representation by minimizing the cost function. Since the number of input elements increases due to the 4th. color space channel, the number of elements in the sparse representation is also increased from 400 to 625. Therefore, each \(256\times1\) image patch vector would be mapped into a \(625\times1\) sparse representation vector. As the visualization of learned features of EDB-UNIQUE shown in Fig. 2, more edge features are introduced to the sparse representation of EDB-UNIQUE than that of UNIQUE, resulting in better edge distortion recognition and thus more accurate assessment results.
| Fig. 2. Visualization of learned features of EDB-UNIQUE | Fig. 3. Visualization of learned features of UNIQUE |
|---|---|
 |
 |
VALIDATION
Database
The proposed quality estimation method is validated with LIVE\({}^{[3]}\) and Multiply Distorted LIVE\({}^{[6]}\)(MULTI-LIVE) databases. The LIVE database has a total of 982 distorted images from 29 reference color images, across 5 different distortion types of Fast Fading Rayleigh, Gaussian Blur, White Noise, JPEG and JPEG 2000 Compression. The MULTI-LIVE database has a total of 450 distorted images from 15 reference color images, with 15 distorted images for each original image under each category of the two distortion composition types of blur and JPEG, and blur and noise.
Thus, the total validation databases used have 1,432 distortion cases, with three distortion groups. The first distortion group, noise group, includes 3 categories in LIVE database, Fast Fading Rayleigh, Gaussian Blur, and White Noise. The second distortion group, compression group, includes 2 categories in LIVE database, JPEG and JPEG 2000 compression. The last distortion group, composition group, consists of the 2 composited categories of MULTI-LIVE database, blur-JPEG, and blur-noise. These 3 groups help simulate real-life distortion cases and assess the corresponding performance in each case type of the proposed quality estimation method.
Performance Metrics
In order to validate our new EDB-UNIQUE image quality assessment method, several performance metrics are utilized to compare between different quality estimators. To compare, correlation metrics are pretty important and essential for such task, thus the Pearson correlation coefficient that measures the linear correlation and the Spearman’s rank correlation coefficient that provides the rank correlation nonparametrically are included in our performance analysis method.
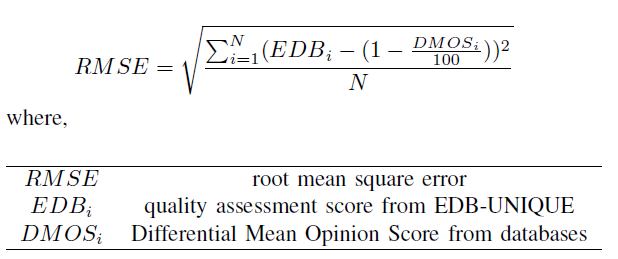
Also, accuracy is another essential criterion for the performance assessment, thus root mean square error is introduced. However, with different scales of the EDB-UNIQUE score and the DMOS (Differential Mean Opinion Score) enclosed in the image databases, some scaling and balancing operations are executed to provide proper meaningful root mean square error data, as shown below.
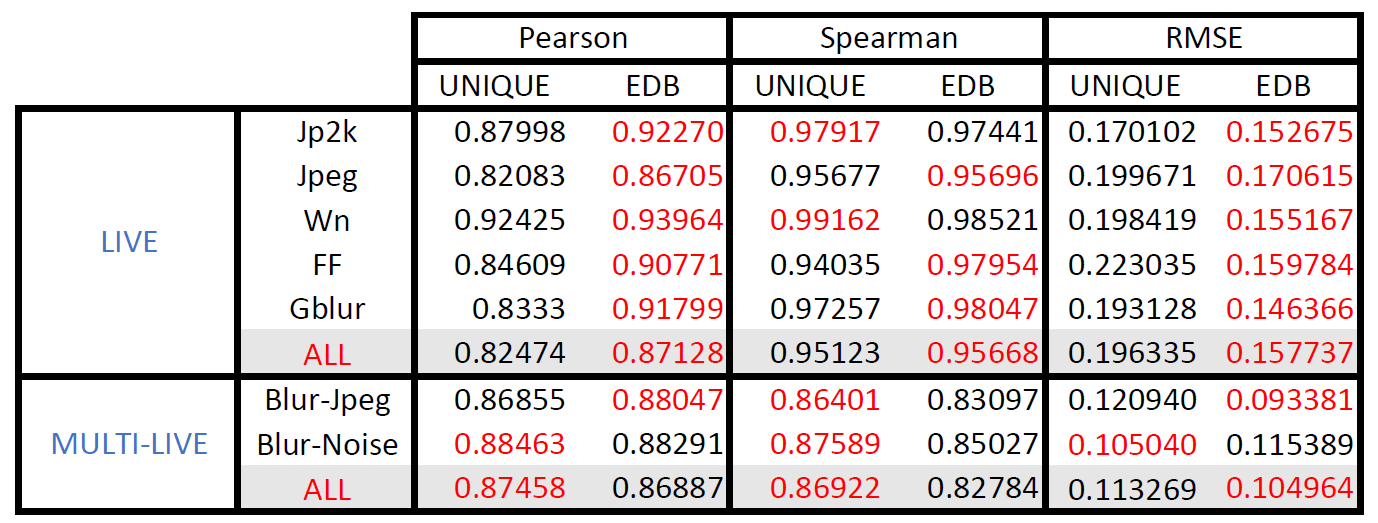
| Fig. 4. Performance result for EDB-UNIQUE and UNIQUE |
|---|
 |
Results
As the result shown in Fig. 4, red marks the better performance in corresponding categories between EDB-UNIQUE and the original UNIQUE. The Pearson correlation coefficient values, representing the linearity, show that EDB-UNIQUE works better under most cases except for the blur-noise type in MULTI-LIVE database, greatly due to the fact that we use the 2nd. power of the correlation coefficient instead of the 10th. power. For accuracy assessment, the root mean square error values tell that EDB-UNIQUE performs better in both LIVE and MULTI-LIVE databases, proving that EDB-UNIQUE estimates the quality of images more accurately. However, EDB-UNIQUE performs worse in those images with blur and noise composited distortion, mainly because such distortion disables the effect of the edge detection filter, the major filter being used.
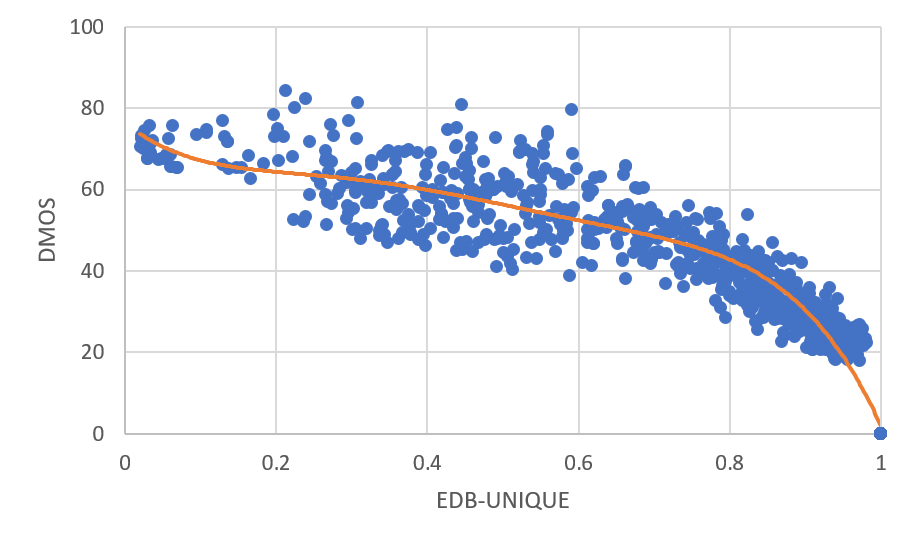
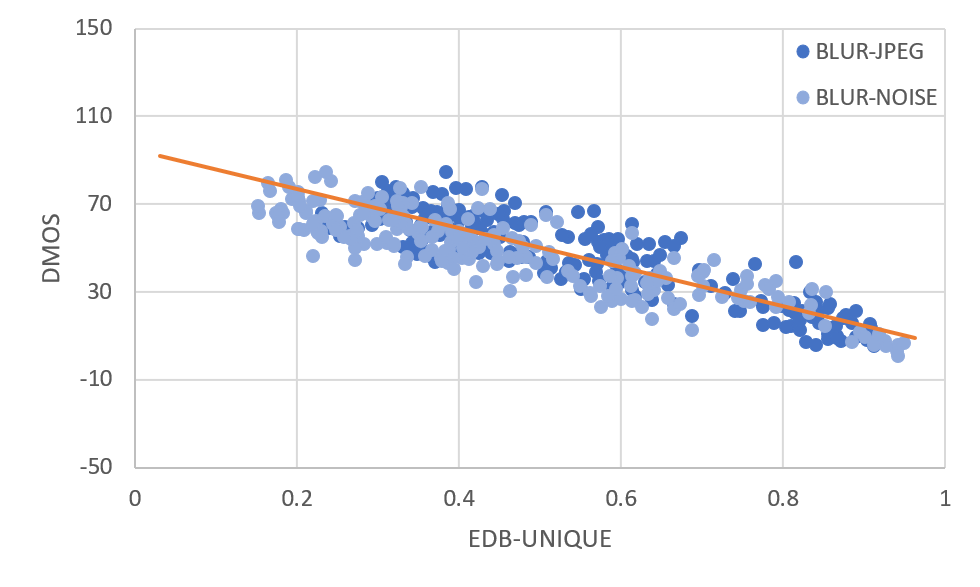
Similar behaviors can be observed in the scatter plot of EDB-UNIQUE for both LIVE and MULTI-LIVE databases. From Fig. 5, the data points closer to \((1,0)\) are more uniformly distributed along the regression curve, while those on the other end are farther scattered from the curve. From Fig. 6, all data points within both distortion categories are uniformly distributed along the regression line.
| Fig. 5. Scatter plot of quality estimator v.s. objective score for LIVE database | Fig. 6. Scatter plot of quality estimator v.s. objective score for MULTI-LIVE database |
|---|---|
 |
 |
CONCLUSION
We propose EDB-UNIQUE as a further optimized method of the quality estimator UNIQUE, by taking the edge distortion into consideration. Such goal is achieved by applying the extended Laplacian edge detection filter to the intensity(Luminance channel) of the images and attached as the 4th. channel of the custom-defined color space. With that, a corresponding new sparse representation is trained for the method. The performance of EDB-UNIQUE, under validation, shows better performance of metrics in most distortion categories except for the blur-noise distortion.
FAILED ATTEMPT
We tried to apply the \(8\times8\) block DCT transformation to the ImageNet database images, followed by the training procedures to obtain a sparse representation of the DCT images, like what we proposed to do in the proposal. However, the results didn’t turn out great, as too little information of the original images is kept in the DCT transformation, thus resulting in a highly uniformed learned feature matrix. Also, the DCT transformation focuses on mainly the low-frequency features, while the other features are lost or ignored, causing the result of image quality assessment not so convincing.
REFERENCE
[1] D. Temel, M. Prabhushankar, and G. AlRegib, “UNIQUE: Unsupervised Image Quality Estimation”, in IEEE Signal Processing Letters, vol.23, no. 10, pp. 1414-1418, Oct. 2016.
[2] O. Russakovsky, J. Deng, H. Su, J. Krause, S. Satheesh, S. Ma, Z. Huang, A. Karpathy, A. Khosla, M. Bernstein, A.C. Berg, and L. Fei-Fei, “ImageNet Large Scale Visual Recognition Challenge”, IJCV, Jan. 2015.
[3] H.R. Sheikh, Z. Wang, L. Cormack, and A.C. Bovik, “LIVE Image Quality Assessment Database Release 2”, http://live.ece.utexas.edu/research/quality.
[4] H.R. Sheikh, M.F. Sabir, and A.C. Bovik, “A statistical evaluation of recent full reference image quality assessment algorithms”, IEEE Transactions on Image Processing, vol. 15, no. 11, pp. 3440-3451, Nov. 2006.
[5] Z. Wang, A.C. Bovik, H.R. Sheikh, and E.P. Simoncelli, “Image quality assessment: from error visibility to structural similarity”, IEEE Transactions on Image Processing , vol.13, no.4, pp. 600- 612, April 2004.
[6] D. Jayaraman, A. Mittal, A.K. Moorthy and A.C. Bovik, “Objective Quality Assessment of Multiply Distorted Images”, Proceedings of Asilomar Conference on Signals, Systems and Computers, 2012.
[7] V.B. Lambrecht, J. Christian, ”Vision models and applications to image and video processing”, Springer Science and Business Media, 2013.
[8] M. Tkalcic, and J.F. Tasic, “Colour spaces: perceptual, historical and applicational background”, in EUROCON 2003. Computer as a Tool. The IEEE Region 8, vol.1, pp. 304308, Sep. 2003.
Code: Access the code and all digital files of the paper from Github